


Principal Investigators


At a Glance
Realizing net-zero emissions of greenhouse gases in the United States requires planning based on realistic, real-world assessments. The Net-Zero America Project aims to provide policy makers with analyses to support such planning. These analyses include estimates of key infrastructure build-outs across the country and potential impacts on industries, communities, existing infrastructure and the natural environment.
Research Highlight
A growing number of US politicians and interest groups have pronounced targets of net-zero emissions (NZE) by 2050 (or sooner). This project will quantify execution challenges and potential impacts over time for NZE technology pathways for the US economy.
To date, researchers have used a suite of energy-system models to define alternative NZE pathways for US energy and industrial systems at a coarse (14-region) geospatial resolution. The modeling considers carbon dioxide (CO2) emissions from energy and industrial systems, as well as non-CO2 emissions and the role that carbon absorption by soils and trees (the “land sink”) might play over time. The balance in 2050 between remaining non-CO2 emissions and the land sink determines the allowable emissions from energy and industrial systems: net negative 0.17 Gt/y of CO2 emissions.
The starting point for identifying each NZE pathway is the US Department of Energy’s Annual Energy Outlook Reference Case projections. That document projects energy-service demands throughout the economy up to 2050. These include passenger vehicle road-miles and air-miles traveled, residential and commercial floor area provided with heating, cooling and lighting, outputs of industries, and others. Industrial energy service demands were adjusted to minimize “offshoring” of emissions beyond today’s level.
The researchers rely on a linear-programming optimization model that incorporates projected energy service demands together with exogenously-specified market penetration rates of energy end-use technologies. The model chooses the mix of primary energy sources and conversion technologies that meet the service demands and achieve NZE by 2050. It makes supply-side choices that minimize the net present value of total energy supply system capital and operating costs from 2020 to 2050. It assumes perfect 30-year foresight, seamless integration of electricity, buildings, industry and transportation sectors, and economically rational decision-making across society.
The researchers model a Reference (“business-as-usual”) pathway based on the technologies and energy-supply mixes envisioned in the Annual Energy Outlook Reference Case. NZE pathways are underpinned by adoption of high-efficiency end-use energy systems, differing extents of end-use electrification, and a variety of technologies for decarbonizing both electricity and fuels.
Figure 1.1 shows modeled CO2 emissions trajectories and associated fossil fuels used in the Reference and four NZE pathways. Biomass use in each of these NZE pathways grows to 13 Exajoules (13 x 1018 Joules) in 2050, the estimated biomass that could be supplied without new lands being dedicated to energy production. (Sensitivity studies are examining higher biomass pathways.) The NZE pathway names reflect key exogenous assumptions and constraints. In the E+ and E- pathways, end-use electrification in transportation and buildings is high and less-high, respectively. In the RE- pathway, the rate of growth in wind and solar electricity is constrained, while in the RE+ pathway, 100% of primary energy supply is from renewable sources by 2050.

CO2 emissions for the US energy and industrial system in different pathways.
Coal use all but disappears by 2030 in all NZE cases. Oil use falls 75%, 65%, and 50% relative to the Reference case in E+, E+ RE-, and E- cases. Natural gas use also declines significantly by 2050 in all cases except E+ RE-, for which the growth in renewable energy is exogenously constrained. Storage of carbon in products such as plastics sequesters 0.4 Gt CO2/year in 2050 in all scenarios, and geologic sequestration of CO2 is significant (0.9 to 1.7 Gt per year in 2050). The exception is E+ RE+, for which carbon sequestration is exogenously disallowed. When the rate of end-use electrification is constrained (E-), an additional 0.4 Gt per year of CO2 must be sequestered by 2050 than with high electrification (E+). This is to offset additional fossil fuel use outside the electricity sector in E-. CO2 storage requirements are still larger when solar and wind expansion is constrained (E+ RE-).
E+ RE+ disallows fossil fuels, CO2 sequestration, and nuclear power by 2050. As a result, dramatically more electricity generation is required by 2050 from wind and solar PV (Figure 1.2). Interestingly, electricity generation in 2050 is higher in E- than in E+, despite end-use electrification being higher in the latter. This is due to the need for electrically-derived fuels in E- to supplement the supply of net zero-carbon fuels made from biomass or fossil fuels.

Annual electricity generation for the U.S., 2020 – 2050, in the Reference and NZE pathways. Total installed generating capacity in 2050 in these cases (left to right) are 1600, 3800, 3200, 2400, and 6300 GW, respectively. For comparison, total installed generating capacity in the U.S. today is about 1100 GW.
The largest portion of increased electricity generation in every pathway comes from wind and solar resources. In E+ RE+, wind and solar account for essentially all generation in 2050. The lowest solar and wind fraction (45%) is in E+ RE-, where the annual growth of wind and solar are constrained to historical record rates. Nuclear and natural gas plants with CO2 capture and storage supply most of the remaining electricity demand in that case. The annual capacity growth rates for solar and wind that must be sustained over multiple decades in all cases except E+ RE- exceed the historical maximum build rates recorded for any nation in a single year (Figure 1.3). In the case of E+ RE-, the required annual build of both nuclear and natural gas with CO2 capture and storage by the 2030s and 2040s is without historical precedent (Figure 1.4).
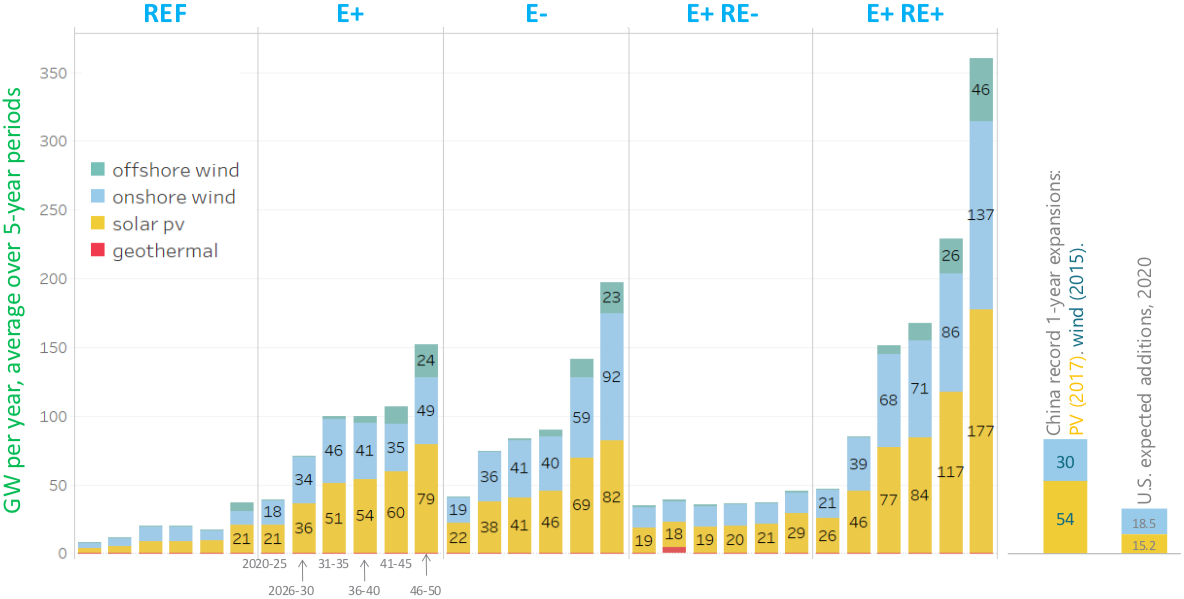
Average annual capacity additions of wind and solar generators in NZE pathways.
Despite the large contributions from wind and solar to electricity generation, curtailments are minimized in all cases (Figure 1.2). This is achieved by coupling wind and solar generation with large loads that operate flexibly. These loads include electric industrial boilers installed redundantly with fuel-fired boilers and electrolyzers producing hydrogen from water. In some cases, considerable amounts of hydrogen are used directly for fuel and as an intermediate energy carrier combined with captured CO2 to make hydrocarbon fuels. Direct capture of CO2 from air is another large flexible user of electricity in some cases.

Average annual capacity additions of thermal generators in NZE pathways.
Broader implications of NZE scenarios include significant shifts in demand-side investment choices and use patterns; widespread industrial transformation; streamlining of public and private-sector investment decision-making processes to drive the capital-intensive transition; high costs to decarbonize remaining liquid and gaseous fuel use; major reform of markets to de-risk and incentivize certain investments; rapid expansion of new industrial capacity and supply chains; significant disruption to incumbent sectors and shifts in employment needs; increased impacts on surface and sub-surface natural environments; and heightened sensitivity by decision makers to impacts of the transition so as to help assure broad social license and community acceptance of changes.
Ongoing work includes downscaling the aggregate regional-scale NZE pathways to state or sub-state spatial scales. The goal is to quantify the on-the-ground magnitude, cost, spatial distribution, and pace of key required plant and infrastructure investments and activities at local levels from 2020 to 2050. Analysis of NZE pathways at this scale is a critical contribution to the research literature and will provide more actionable guidance for policy makers and stakeholders across the US.