
Principal Investigator

At a Glance
Novel analyses of extreme weather data have revealed unanticipated statistical patterns in heat exchange between the oceans and atmosphere and have identified a trend of increasing frequency for extreme weather events in modern times.
Research Highlight
The Climate Variability Project for the last two years has been investigating the effects of climate change on climate variability in general and extreme weather in particular. The Pacala group has focused on extremes of heat and precipitation, on drought, and on the repeated instances of warming hiatus that have occurred since the late 19th century. In the past year, postdoctoral associate Monica Barcilowska has produced a new analysis of the periods of warming hiatus in data. The analysis identifies a periodic statistical pattern with a 66-year period of variation in heat exchange between all the ocean basins and the atmosphere. Barcilowska is also producing new global analyses of extreme precipitation, drought and heat waves. Postdoctoral associate Dan Li is focusing on urban environments and has built a new urban tile into climate models to analyze historical data and perform computational experiments to model the impact of large cities on local extreme weather, including extreme heat.
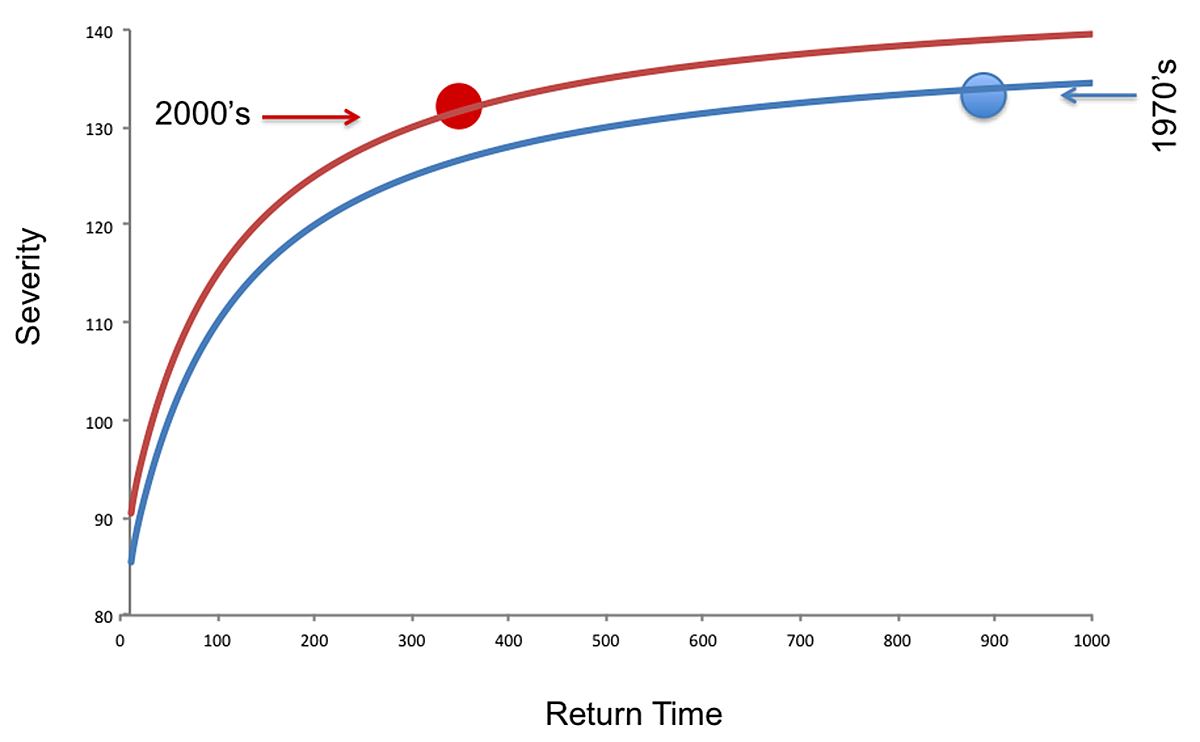
The research is motivated by the remarkable and counter-intuitive historical record of very large increases in the frequency of extreme weather since the 1960’s and 70’s. The Intergovernmental Panel on Climate Change Fifth Assessment Report (IPCC AR5) shows that nighttime high temperatures that occurred only once in 20 years during the 1970’s, occurred on average once in 8 years by the 1990’s. For the last three years, the Bulletin of the American Meteorological Society (BAMS) has published an annual special issue with papers attempting to estimate how the odds of an extreme weather event have changed because of anthropogenic greenhouse gases and aerosols. Many of these papers calculate increases of 10- to 100-fold or more. How can the extremes change so much when the mean climate has changed very little? Figure 3.1 suggests one way to understand this phenomenon, expressing the probability density of a weather event as a plot of severity (e.g., maximum temperature in a heat wave or maximum 24-hour precipitation) versus return time (the reciprocal of the annual probability of occurence). These plots are almost invariably asymptotic at high return times, because physical laws prevent arbitrarily high levels of severity. A small increase in the mean severity shifts the climate from the blue to the red curve. There are many examples like this in the literature produced by climate models for extremes of temperature, precipitation and drought including several in each BAMS special issue. Very large changes in return time can occur for the most extreme events because the return time-severity plots are flat at levels of high severity.
The consequences of such changes in variability are significant. Extreme weather creates direct risks for many of the world’s capital assets, from ports and floating platforms lashed by storms to withered crops. Abrupt changes in public opinion and carbon policy might be triggered by damaging weather, whether or not the triggering event is caused by climate change due to anthropogenic greenhouse gases.